MACD, short for moving average convergence/divergence, is a trading indicator used in technical analysis of stock prices, created by Gerald Appel in the late 1970s.It is supposed to reveal changes in the strength, direction, momentum, and duration of a trend in a stock's price.
The MACD indicator (or "oscillator") is a collection of three time series calculated from historical price data, most often the closing price. These three series are: the MACD series proper, the "signal" or "average" series, and the "divergence" series which is the difference between the two. The MACD series is the difference between a "fast" (short period) exponential moving average (EMA), and a "slow" (longer period) EMA of the price series. The average series is an EMA of the MACD series itself. This is the resume how use MACD indicator on metatrader.
BUY SIGNAL
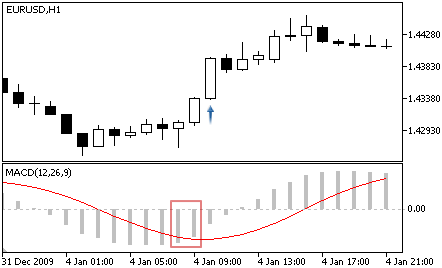
- Reverse — the oscillator turned upwards (the oscillator rises at the analyzed bar and falls at the previous one).
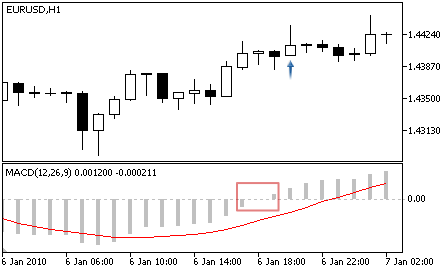
- Crossover of the main and signal line — the main line is above the signal line at the analyzed bar and below the signal line at the previous one.
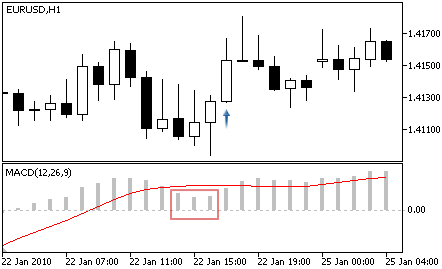
- Crossing the zero level — the main line is above the zero level at the analyzed bar and below the zero level at the previous one.
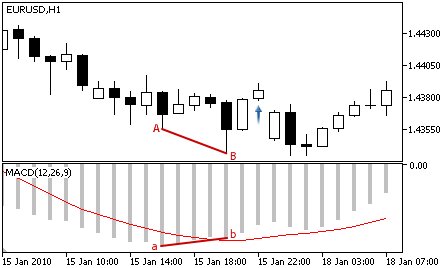
- Divergence — the first analyzed bottom of the oscillator is higher than the previous one, and the corresponding price bottom is lower than the previous one.
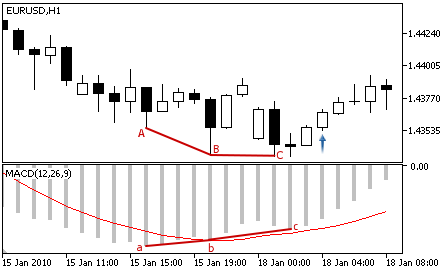
- Double divergence — the oscillator form three consequent bottoms, each of them is higher than the previous one; and the price formed three corresponding bottoms, and each of them is lower than the previous one.
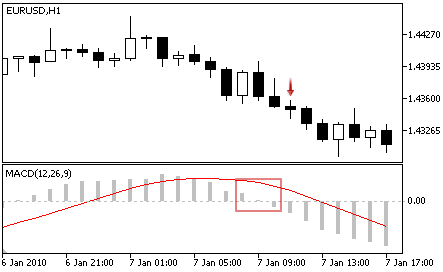
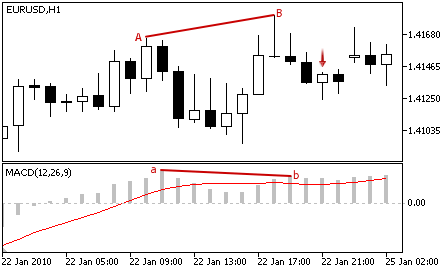
SELL SIGNAL
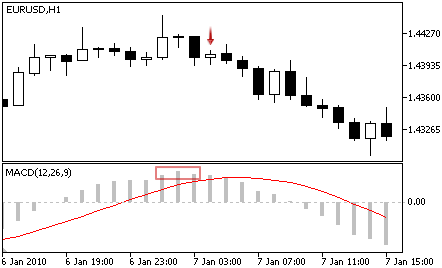
- Reverse — the oscillator turned downwards (the oscillator falls at the analyzed bar and rises at the previous one).
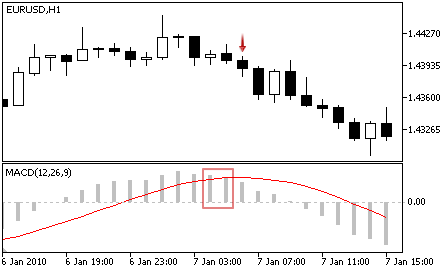
- Crossover of the main and signal line — the main line is below the signal line at the analyzed bar and above the signal line at the previous one.
- Crossing the zero level — the main line is below the zero level at the analyzed bar and above the zero level at the previous one.
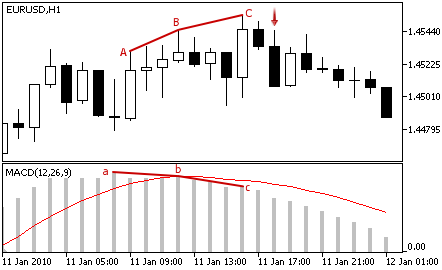
- Divergence — the first analyzed peak of the oscillator is lower than the previous one, and the corresponding price peak is higher than the previous peak.
- Double divergence — the oscillator formed three consequent peaks, each of them is lower than the previous one; and the price formed three corresponding peaks, each of them is higher than the previous one.